Demonstrations · Made-up material
Monthly reporting pack: variance table, draft commentary and questions
Claude takes the month's management accounts, the budget and last month's board commentary, builds the variance table, drafts the commentary, and lists the movements the numbers don't explain.
This is a demonstration. The business, people, documents and figures are made up for this example. It is not client work.
Relevant to: Financial controllers and finance teams in mid-sized companies who produce a monthly board or management pack.
The made-up situation
Brookfield & Daly is a food distributor with about €38m turnover a year, selling to foodservice and retail customers. Sinéad Kavanagh, the financial controller, has closed September 2026. September was the first month of a new retail contract with Northgate Stores. She needs the board pack out within the week.
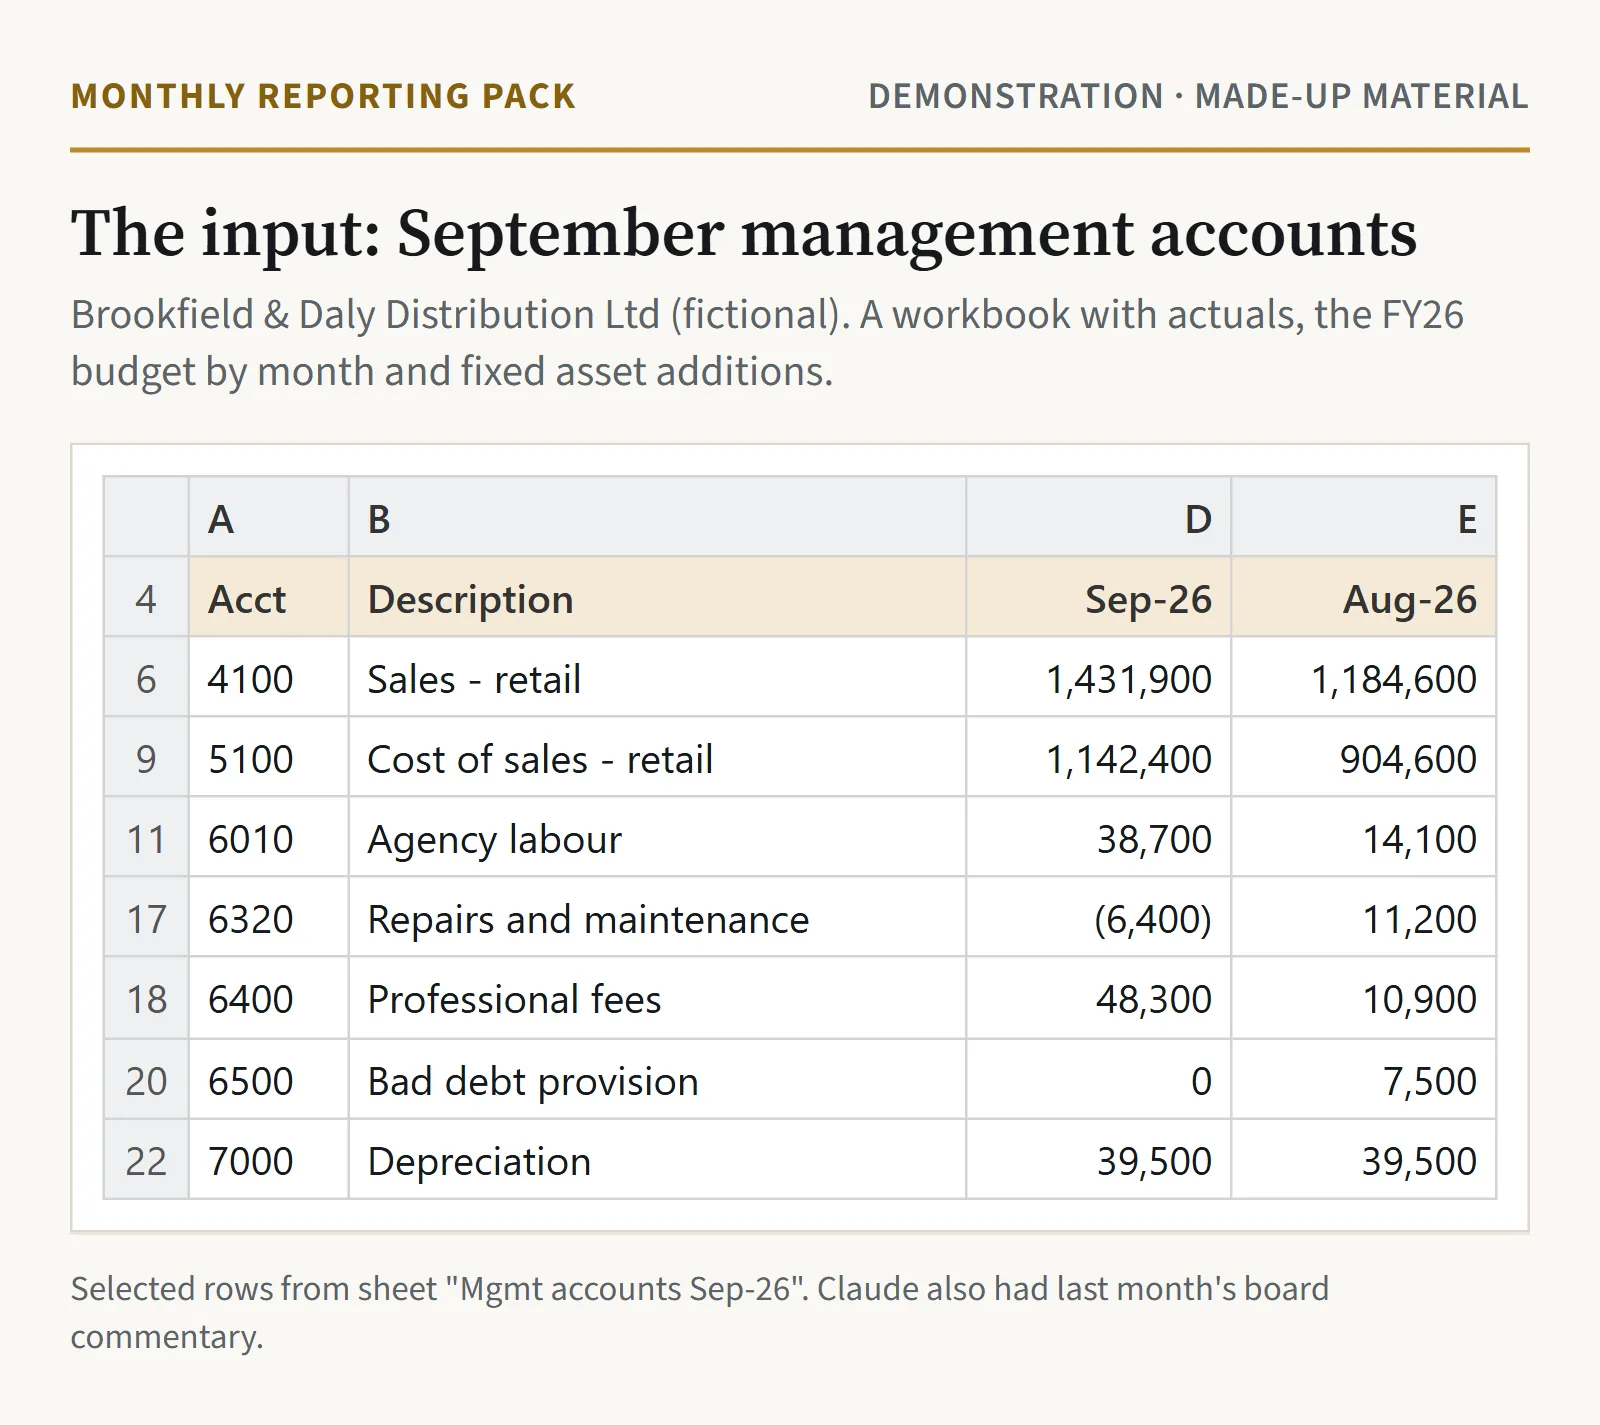
Her inputs are a workbook exported from the ledger, with three sheets (September and August actuals and year to date, the FY26 budget by month, and fixed asset additions), and her own August commentary to the board.
Step by step
1Ask Claude to build the variance table
Sinéad saves the workbook to the finance SharePoint folder and asks Claude, with the Microsoft 365 connector on:
What the person types Open Brookfield-Daly-Management-Accounts-Sep-2026.xlsx in Finance > Month End > 2026-09. Build a variance table for September against budget: every account line, then totals for revenue, cost of sales, gross profit, overheads, EBITDA and profit before tax. Take September budget from the Budget FY26 sheet and work out year-to-date budget as January to September. Show actual, budget, variance in euro and percent, favourable or adverse, August actual, and YTD. Costs are positive numbers. Give me the table as an Excel file too.
2The variance table comes back
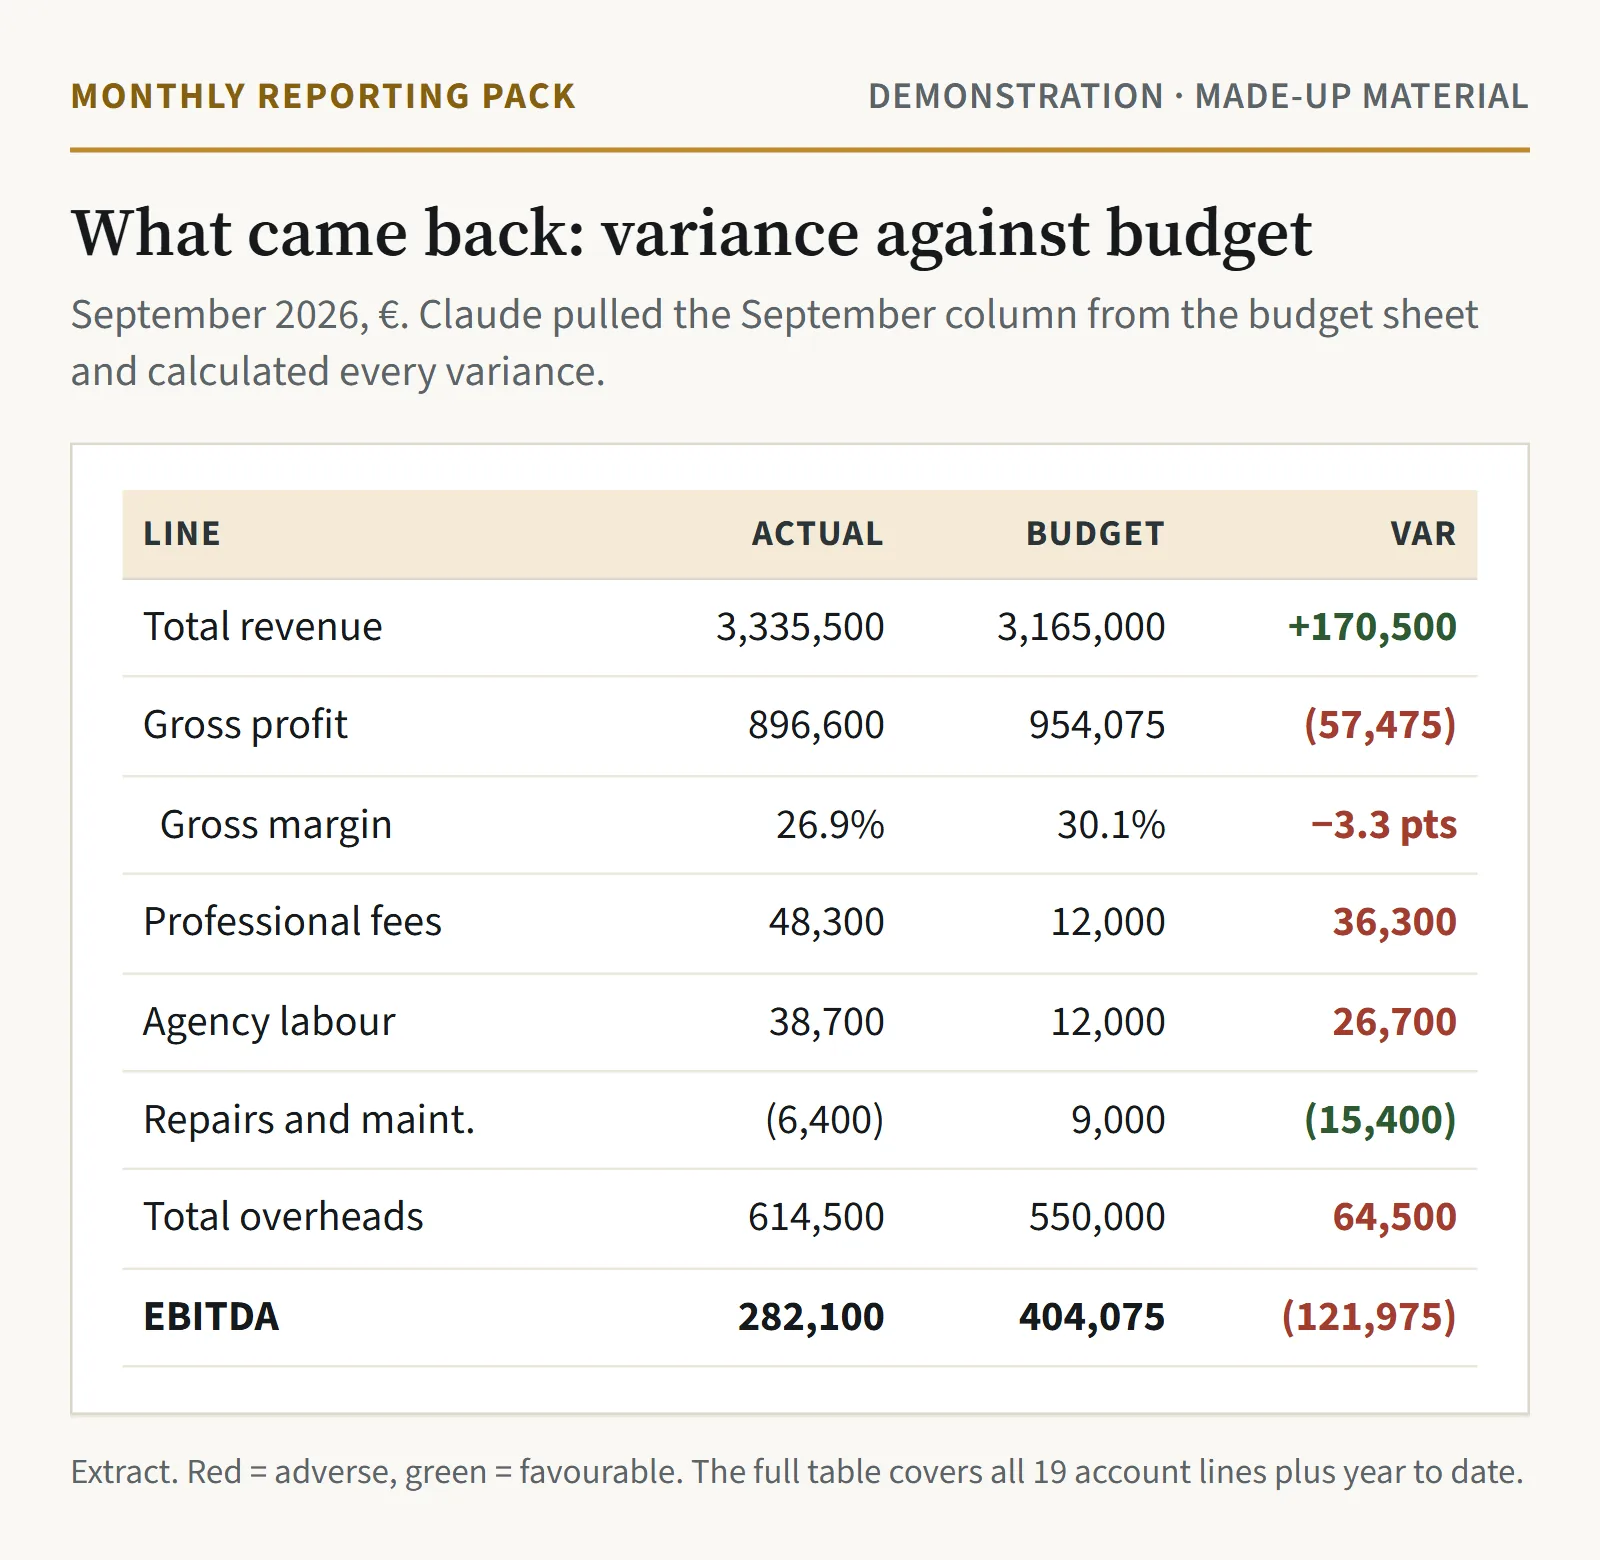
Line Sep actual Sep budget Variance Total revenue 3,335,500 3,165,000 170,500 F Gross profit 896,600 954,075 (57,475) A Gross margin 26.9% 30.1% -3.3 pts Total overheads 614,500 550,000 64,500 A EBITDA 282,100 404,075 (121,975) A Revenue is ahead of budget, but EBITDA is €122k behind. The full table covers all 19 account lines and the year to date, in the pack and as an Excel file.
3Draft the commentary using last month's as the reference
What the person types Now draft the September commentary in the same format as my August commentary (attached). Use August's commentary to tell what was expected from what wasn't. Where the figures don't explain a movement, don't guess: mark it [CHECK] and add it to a separate list of questions for me.
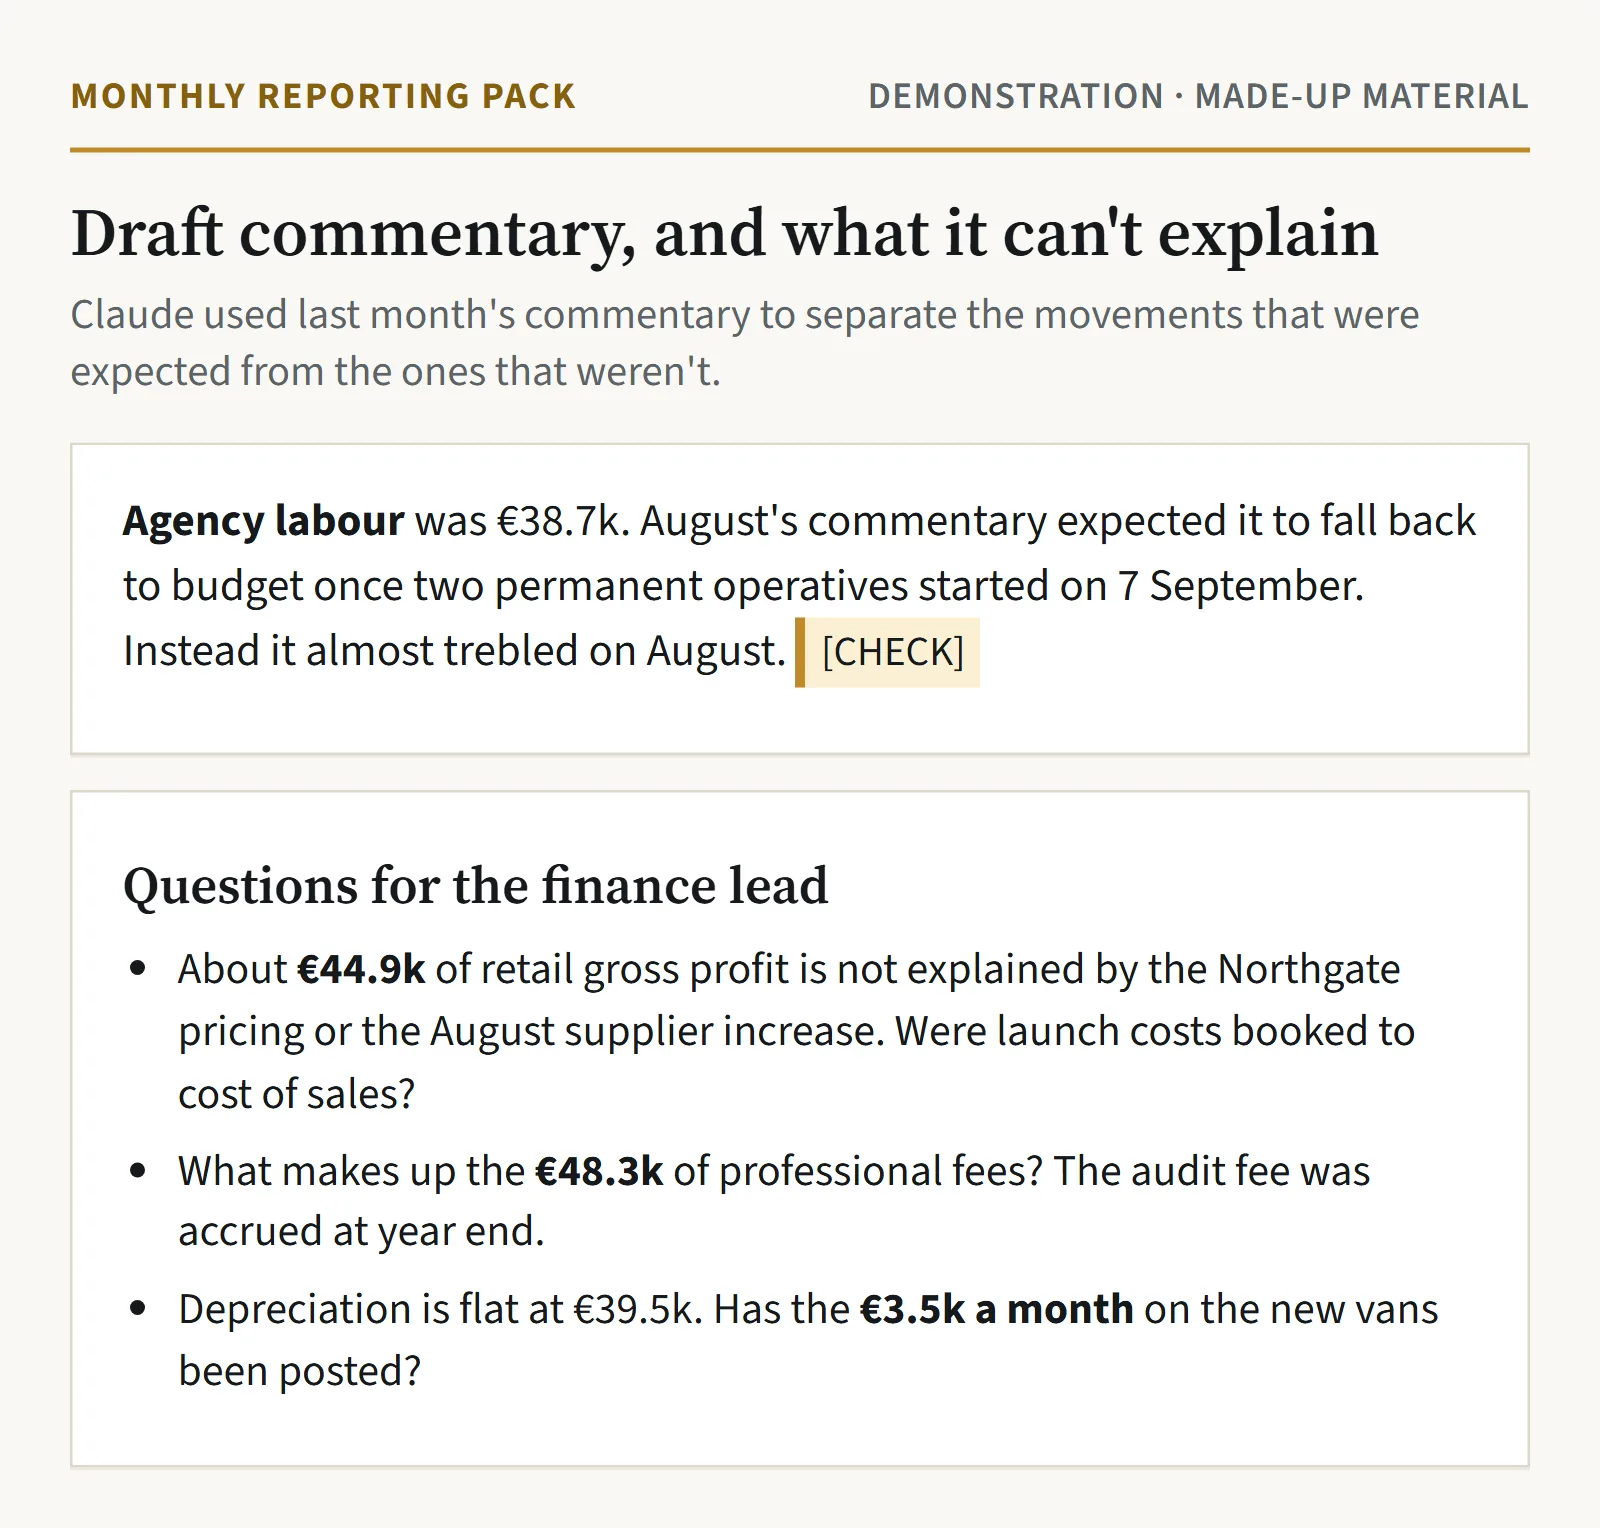
Claude used the August commentary to separate expected movements from surprises. Fuel and electricity were over budget, but August had predicted both, so they are explained in the draft. Retail margin is a different story. August said Northgate was priced at about 22% margin against a 27% budget, and a supplier price rise had already cut retail margin to 23.6%. Claude built an approximate bridge and found that those two causes leave about €44.9k of retail gross profit unexplained:
Retail gross profit bridge (approximate) € Retail GP at budget margin (27.0% of €1,431.9k) 386.6k Northgate priced at ~22%, not 27% (12.4k) Supplier increase, at August's 23.6% margin on the rest of retail (39.8k) Not explained by the August commentary (44.9k) Actual retail GP 289.5k Claude stated the assumption behind the bridge: that the whole €247.3k rise in retail revenue on August is Northgate. It then flagged that assumption as something to check against the sales ledger.
4The questions for the finance lead
Claude listed seven movements that the figures do not explain on their own, each with where it shows up. Among them:
- Professional fees of €48.3k against €12.0k budget. The audit fee was accrued at year end, according to August's commentary, so it isn't that.
- Agency labour almost trebled when August's commentary said it would fall back to budget once two permanent staff started.
- A €6.4k credit on repairs and maintenance.
- No bad debt charge, while a customer owing €38k was already 75 days overdue at the end of August.
- Depreciation flat at €39.5k. The fixed asset sheet shows three new vans that should add €3.5k a month from September.
5What the finance lead checks before it goes out
- Ties the table to the ledger. Total revenue, gross profit and EBITDA in Claude's table should match the trial balance and the management accounts. Sinéad spot-checks three or four lines by hand.
- Answers the seven questions. Some will lead to journals before the pack goes out. If the van depreciation was missed, posting it reduces profit before tax by €3.5k. If the overdue customer needs a provision, EBITDA falls further.
- Replaces the Northgate assumption with the actual September invoicing from the sales ledger and asks Claude to rerun the margin bridge.
- Removes every [CHECK] marker and rewrites those paragraphs with the real explanation.
- Reads it as the board will. She checks the headline messages are the ones she wants to lead with, and that nothing in the draft states a cause the evidence does not support.
Time taken
A typical estimate, not a measured result
For a pack like this a financial controller usually spends four to six hours on the variance table and first-draft commentary, before review. With Claude the table, draft and questions come back in a few minutes. Checking the table and answering the questions is still the finance lead's job and would typically take one to two hours, plus whatever journals the questions lead to. The time saved is in building and writing. The questions list also catches problems, like the missing depreciation, that are easy to miss when the deadline is close.
How this demonstration was made
We wrote the workbook and the August commentary for this demonstration. Claude then produced the outputs by reading those files. We calculated every figure in the variance table with a script from the workbook, and checked every number in the commentary and the questions against that table. In a company's setup the workbook would sit in SharePoint and Claude would open it through the Microsoft 365 connector, as in the first step.
The source documents and Claude's full outputs are not published here. The excerpts and images on this page show what came back.
Claude features used, with Anthropic's documentation
- With the Microsoft 365 connector, Claude can read Excel files (including older .xls) from SharePoint and OneDrive, as well as Word and PDF files. Claude Help Center: Enabling and using the Microsoft 365 connector
- Claude only sees files the user already has permission to view in Microsoft 365. Claude Help Center: Enabling and using the Microsoft 365 connector
- Claude can create Excel spreadsheets, Word documents, PowerPoint decks and PDFs, and run code to analyse data. The help article notes that outputs may need review. Claude Help Center: Create and edit files with Claude
Doing this with your own work
For a real team we build the same kind of workflow in your Claude organisation, test it on your past work and train the people who will use it.
That is usually a workflow implementation. Ways to start sets out what it includes and what we need from you.
Talk to us about a piece of work like this
Tell us what the work is and who does it now. We'll suggest a time for a short call.